
Data
How did they do that? Election Forecast Edition
In this series, Interhacktives asks how journalists have created specific data journalism projects.
Data
In this series, Interhacktives asks how journalists have created specific data journalism projects.

How-To
Where can I get free copyright images? It’s a question that goes through everyone’s head in a newsroom at some point, especially if they’re not at a major publication.

How-To
There are many apps available to serve tech-savvy journalist’s daily needs. But there are never too many, so it’s a good habit to take advantage of any relevant to our work, like this one. In October 2020 French IT-developer Cyril Diagne released a beta version of

Audience & Social
New to social media journalism? Use this beginner's guide to TweetDeck for journalists and learn all of the best tips and tricks to improve your Twitter experience.

Audience & Social
Looking to improve your Twitter profile? Here are all the tools that journalists need to maximise Twitter potential! When entering the world of journalism, acclimatising to the numerous social media platforms can be a daunting prospect. Twitter has become an essential platform for journalists as it is a fantastic means

Audience & Social
LinkedIn have become the latest social media platform to jump on the stories bandwagon. Here's how journalists can make the most of the new feature.

Audience & Social
Tuesday 3rd November 2020 is set to be a career-defining moment for many journalists tackling one of the world's biggest news events. This is the Interhacktives' complete low-down on how to bulk up your coverage using social media.

Features
Here is how you can see if an image circulating online is fake or not?

Data
R is the perfect language for data mining and scraping, especially when it comes to manipulating datasets that Excel just can’t handle. But, as important as the analysing and cleaning processes may be, visualising information is a key aspect when doing data-lead journalism! Luckily for us, R includes

How-To
Are you making your first steps onto the #mojo journey? Follow this series for a practical list of tips!

Data
Core R is an incredible tool to manage data and can produce satisfactory data visualisations. But what if you want more control?
Data
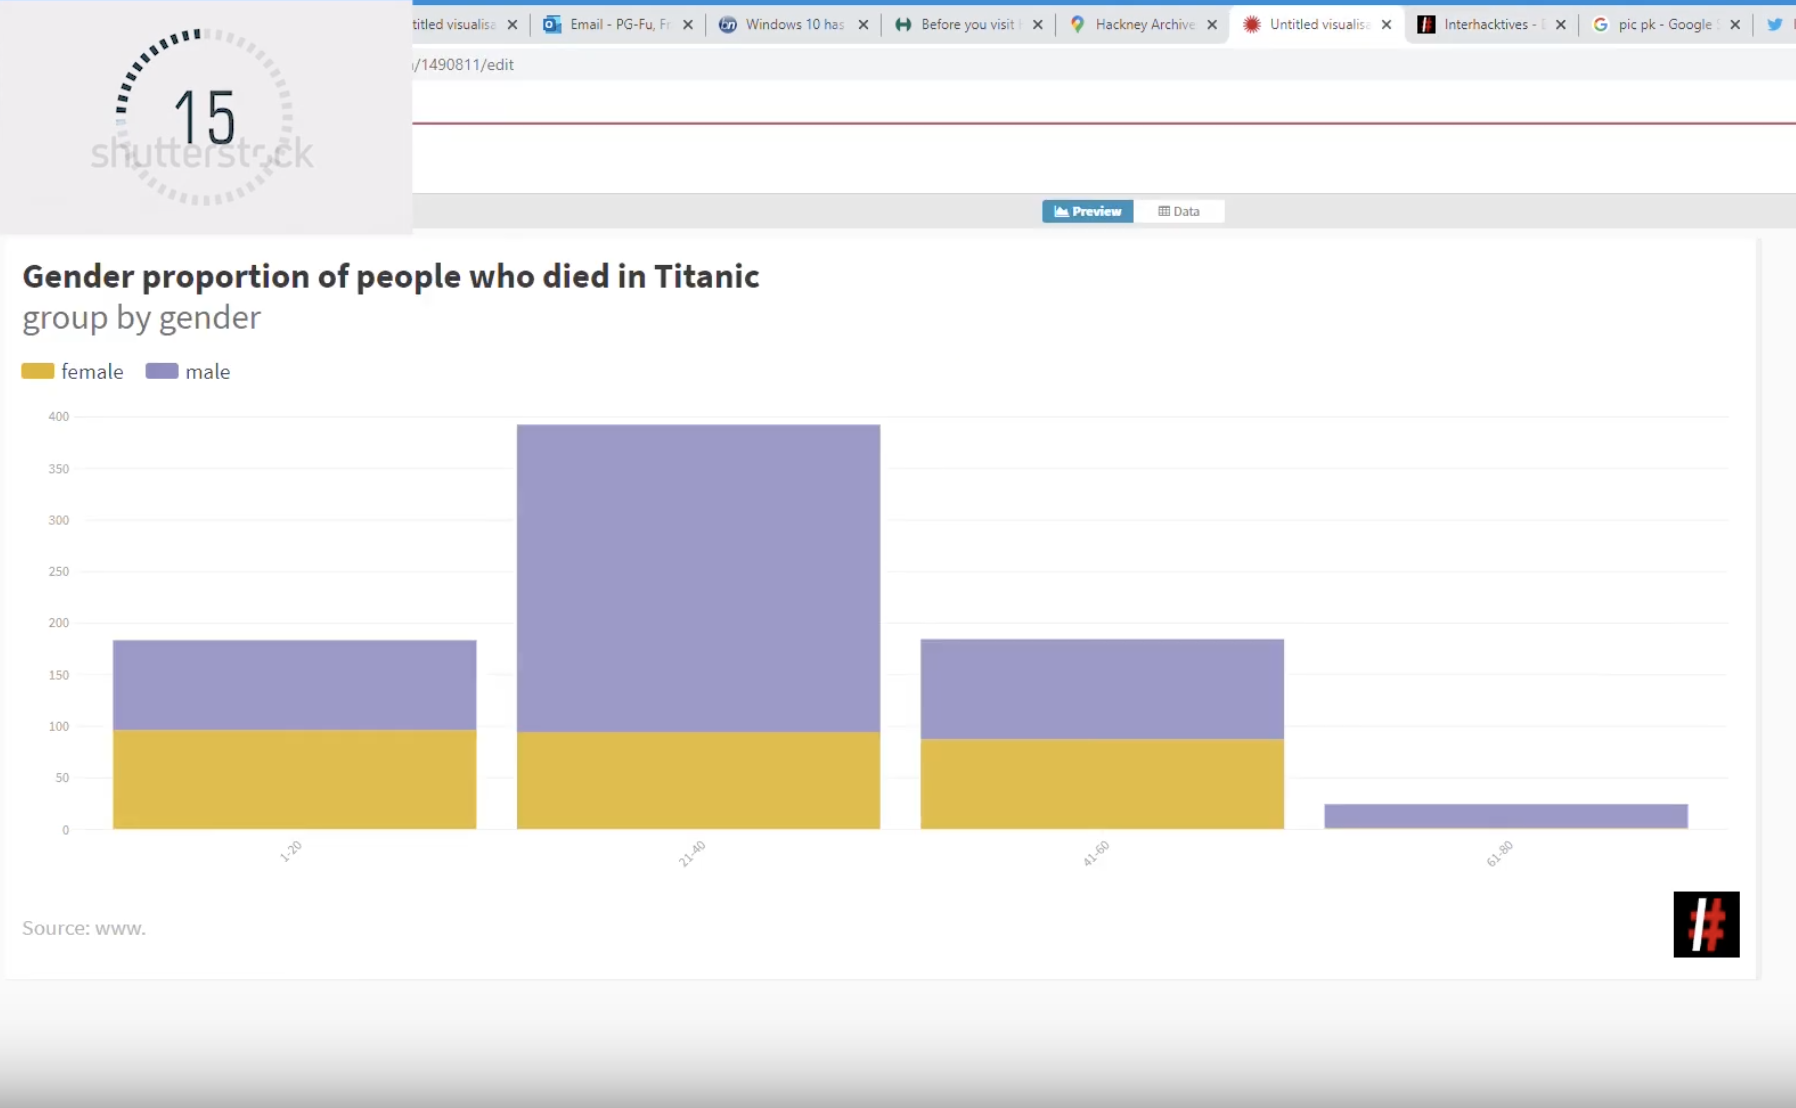
There are many easy ways to create charts. In these video tutorials we introduce two different ways to make charts in under a minute.