
Data
How to visualise Google Trends data?
Visualising data from Google Trends can provide valuable insights into the world around us. Give our tutorial a try and see what insights you can uncover.
Data
Visualising data from Google Trends can provide valuable insights into the world around us. Give our tutorial a try and see what insights you can uncover.

Data
These 7 female data journalists are making waves with their incredible work

Audience & Social
Canva has integrated Google Sheets, allowing users to transform data into eye-catching data visualisations.

News
Climate change is upon us, and it can be difficult to grasp what the consequences are. Data journalists can help the reader understand the immediate and long-term effects by using interactive maps and graphs. Here are five of our favourite data visualisation stories. The climate disaster is here – The

News
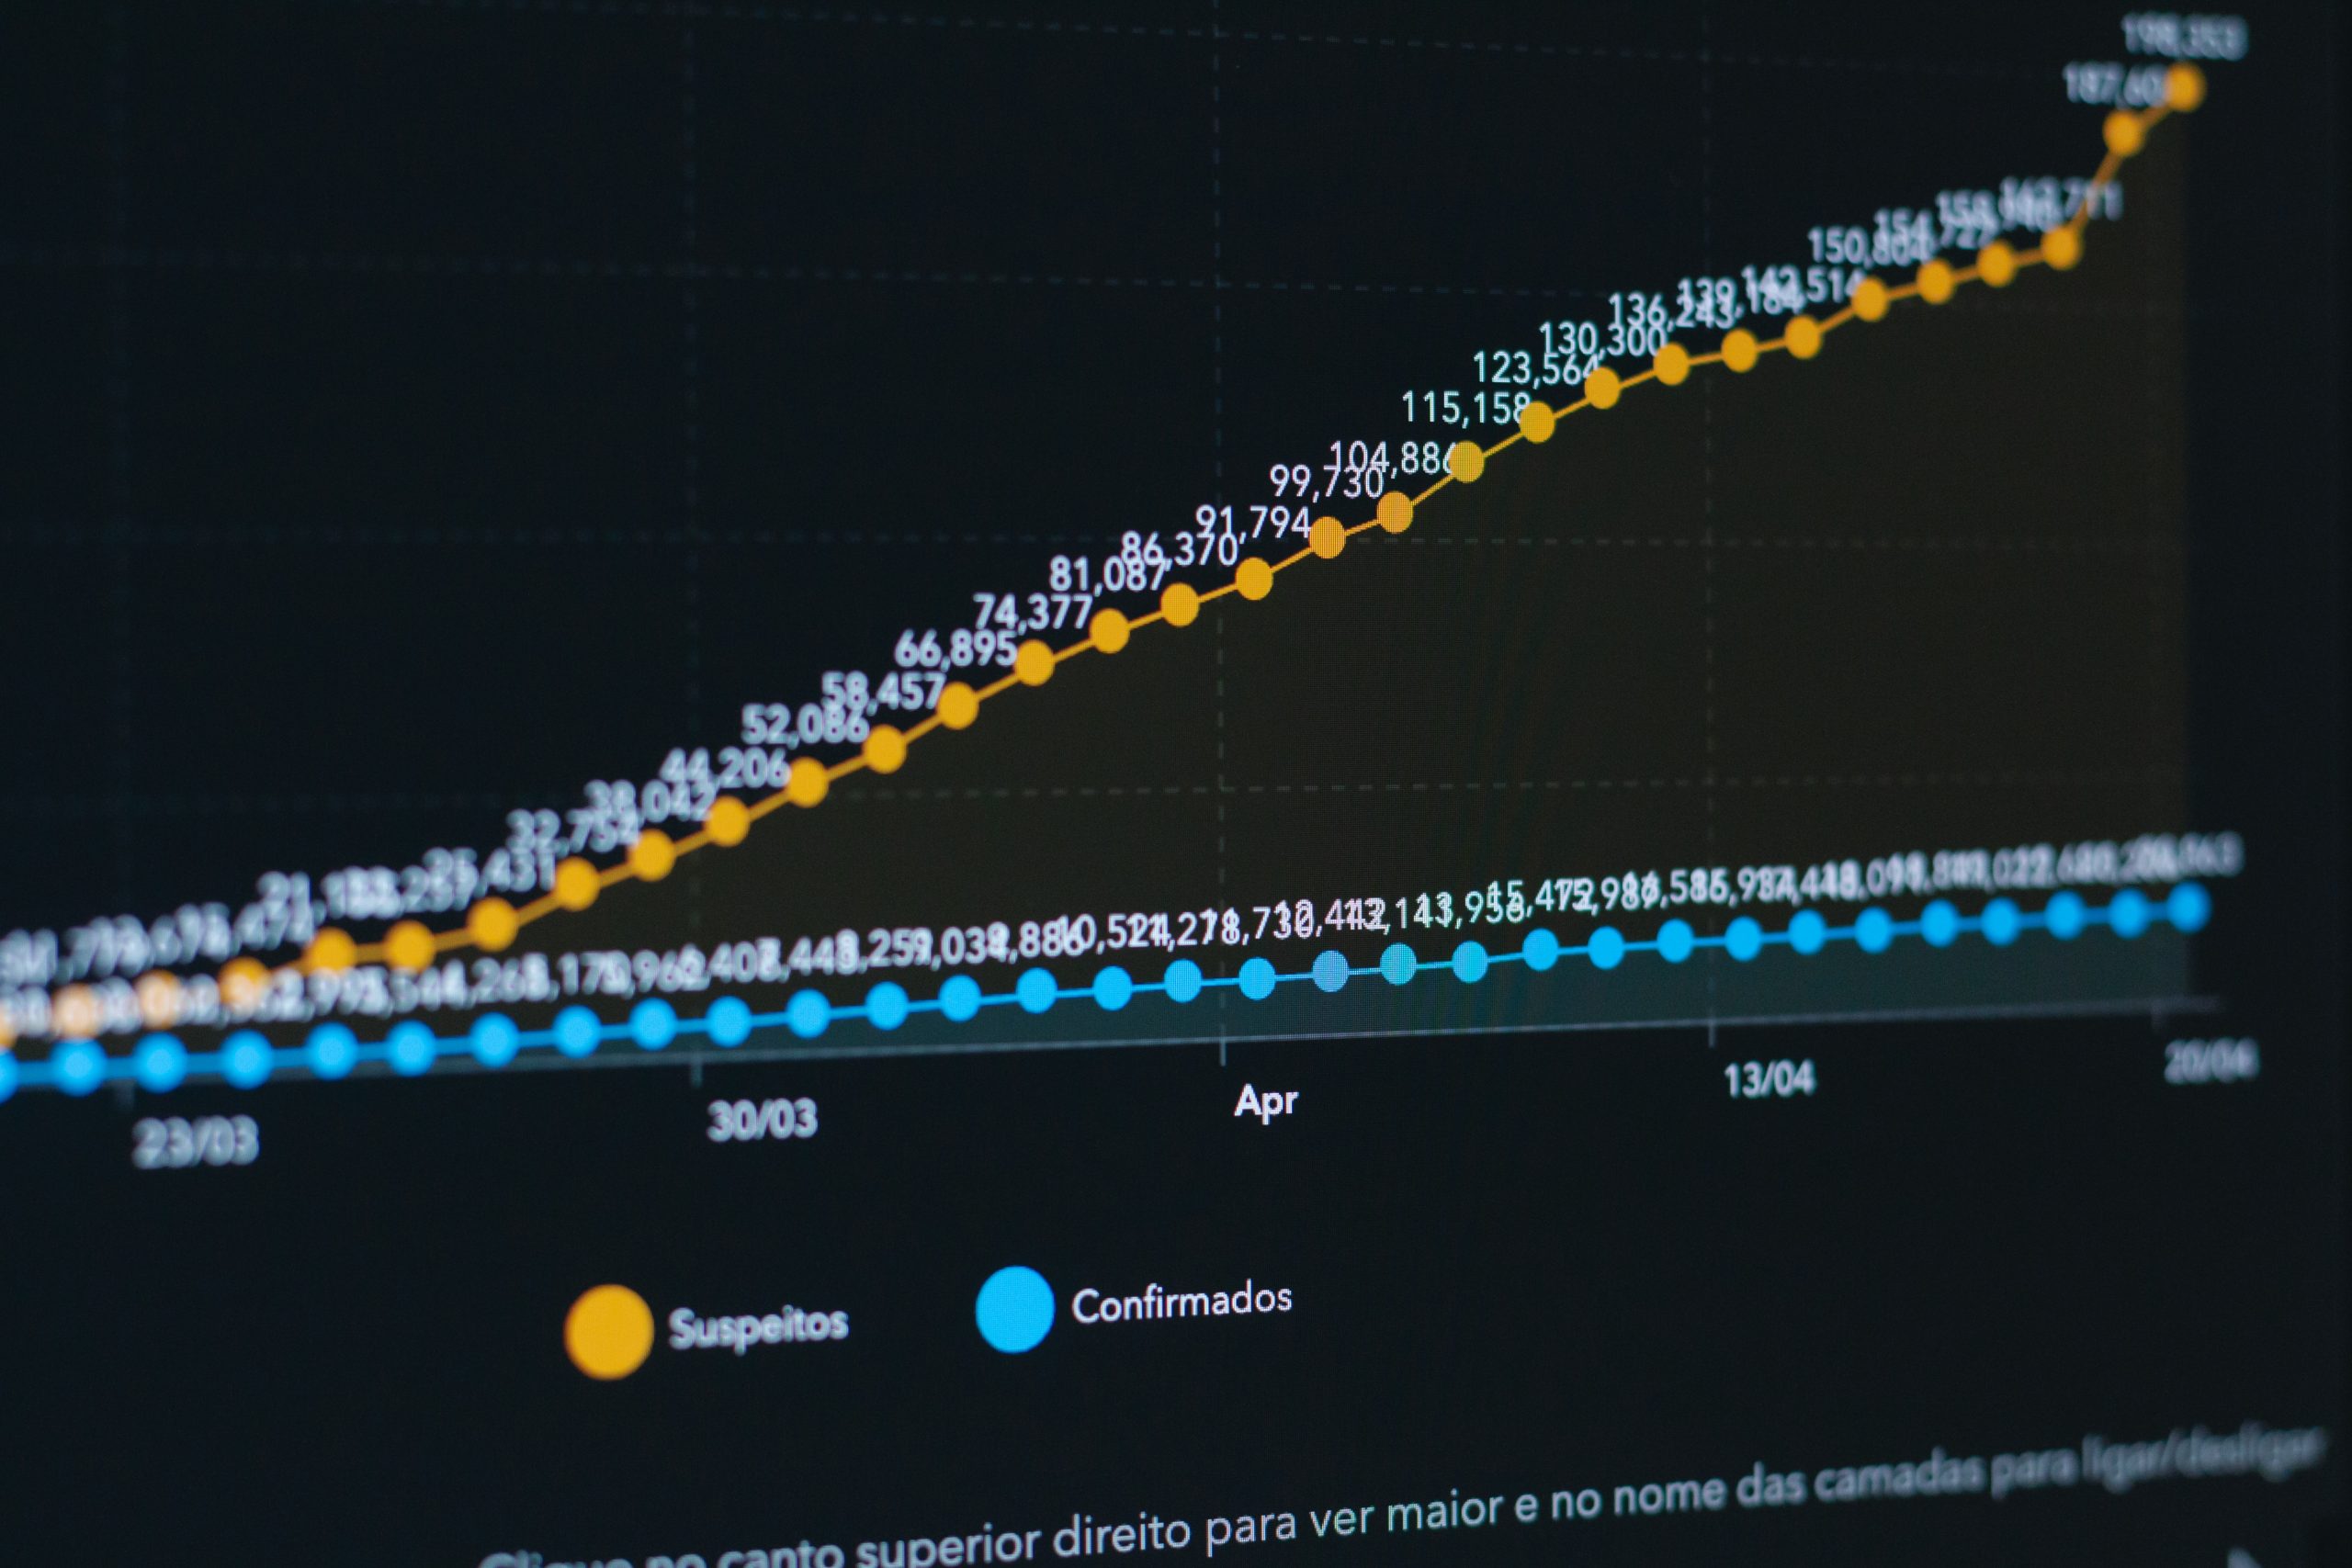
Joely Santa Cruz speaks to Michael Simmons about how he built his Edinburgh Coronavirus Data website.
Data
Data Visualisation is a great way to covey data to readers but sometimes visualisation can go wrong or be very misleading. If you want to get started but don't know how, take a look at this article. Once you've got to grips with the basics, you&

Data
New to journalism and keen on data? Here's a list of the top 5 free visualisation tools to create stunning visual data.

Data
5 data visualisation articles excellently exploring the coronavirus

Data
Core R is an incredible tool to manage data and can produce satisfactory data visualisations. But what if you want more control?
Data
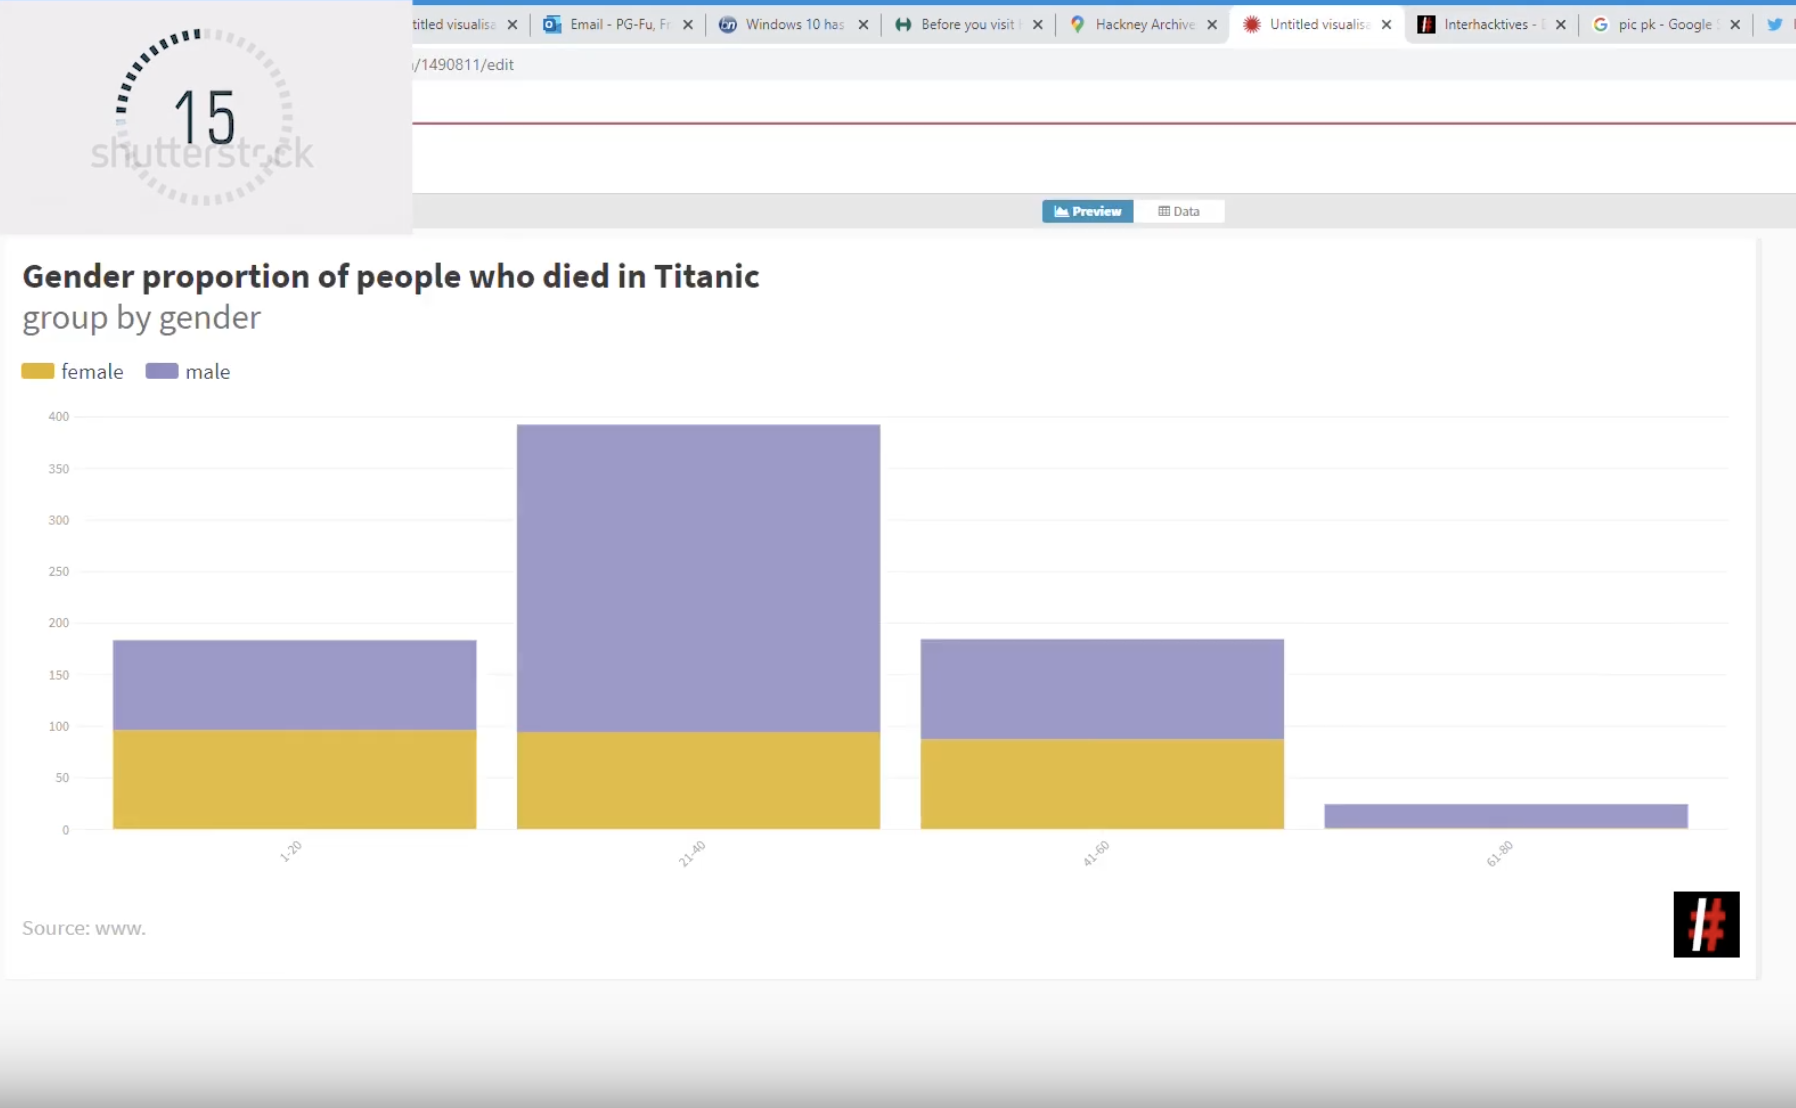
There are many easy ways to create charts. In these video tutorials we introduce two different ways to make charts in under a minute.

Audience & Social
While Twitter is a journalist’s playground trying to find individual journalists on Instagram can be testing. But Instagram is the perfect platform to showcase creative and visually stimulating data-driven journalism. Additionally, Instagram's interactive tools make it more fun to engage with news. If you are interested

Data
We all know that data visualisations can really bring an article to life. However, I've learned from experience that it's easy to become so engrossed in making a data vis that you compromise the quality by overlooking key elements. Learn from my mistakes and make sure