
Data
Interview with import.io's Beatrice Schofield
Beatrice Schofield, Head of Data Intelligence at import.io talks to Interhacktives’ Aleksandra Wisniewska and debunks the data science myth.
Data
Beatrice Schofield, Head of Data Intelligence at import.io talks to Interhacktives’ Aleksandra Wisniewska and debunks the data science myth.

Data
Set up by Tim Sabat, Chris Coyier and Alex Quez in 2012 as a coding playground for front end development, CodePen is a site that allows both beginners and experienced coders to try building for the web. Many of the more experienced visitors use the platform to test out initial
Data
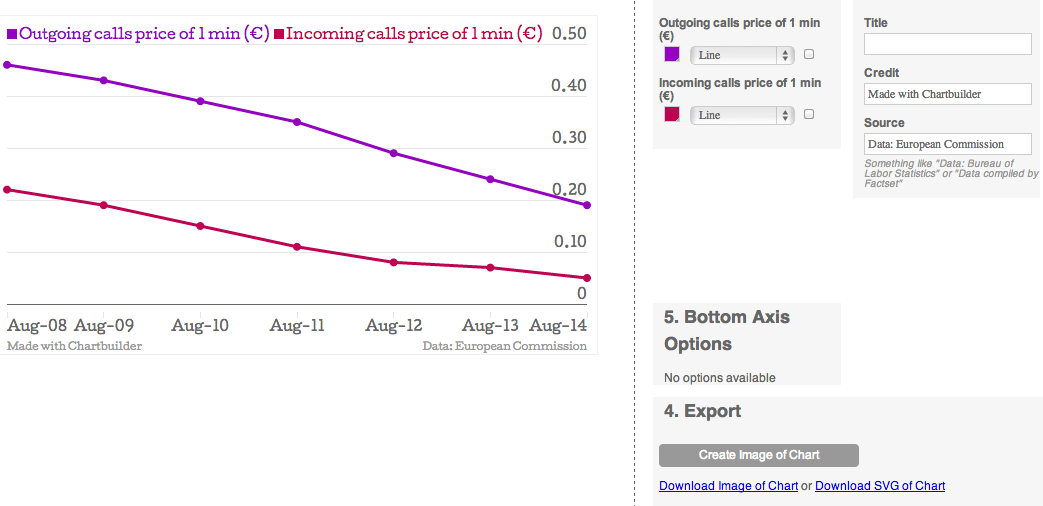
There appears to be a real appetite for new tools which attempt to make life easier for data journalists. Ranging from the advanced, like the powerful software for cleaning messy data Open Refine, to the simple interactive chart-maker Datawrapper, a real favourite among the data driven journalism community, data

Data
If you are an aspiring data journalist, don't miss out on this opportunity to be published by Ampp3d: the Daily Mirror's experimental site for data visualisation. Create a mobile visualisation Entrants are invited to create a mobile-friendly data visualisation reflecting a current news story, with
Data
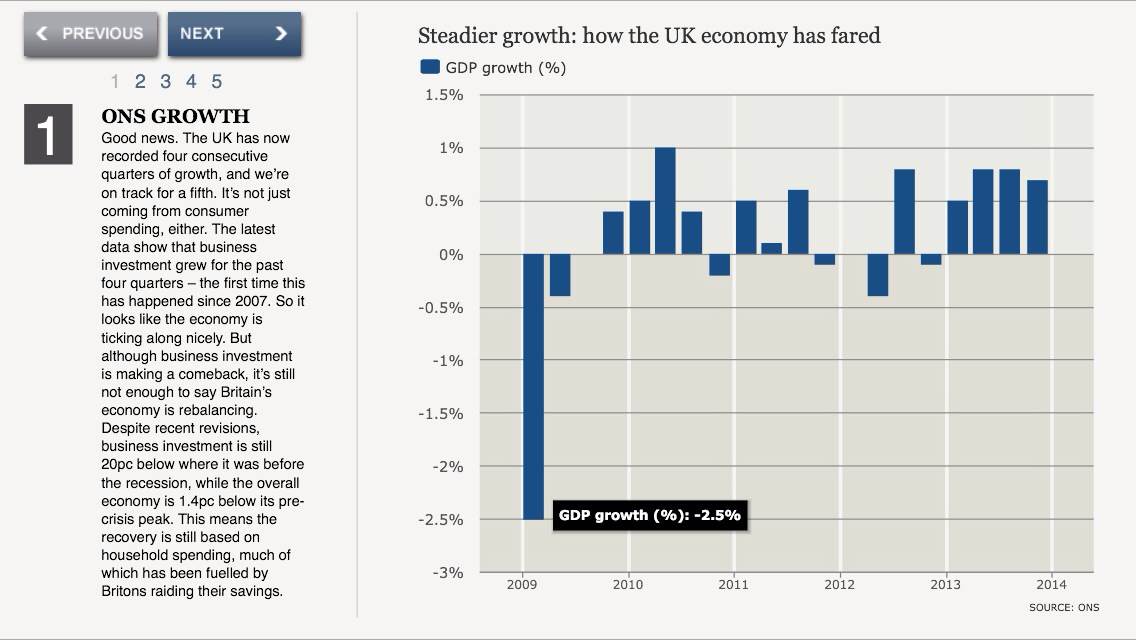
The 2014 Budget saw some great data coverage, but it showed that one of data journalism's biggest challenges lies in working well on mobile devices.

Data
Manuel Lima is the Design Lead at Codecademy, an online interactive platform offering free coding classes in programming and markup languages. He’s also the founder of visualcomplexity.com, a unified resource space for anyone interested in the visualisation of complex networks. Here he talks about developing your own business

Data
Are sports fans interested in data stories? Sophie Murray-Morris spoke to sports data journalist David Dubas-Fisher to find out...
Data
From today, we are accepting entries for our competition to by published by Ampp3d: the Daily Mirror's experimental site for data visualisation. Create a mobile visualisation Entrants are invited to create a mobile-friendly data visualisation reflecting a current news story, with the winner having their visualisation published

Data
Piktochart is a website that allows you to create infographics in an easy way. With its simple and clear style, it’s perfect for small datasets that can be explored from a number of different angles. I am going to take you through the process of creating an infographic using
Data
Ampp3d's Martin Belam tells us what makes a winning data visualisation. What Ampp3d’s about There have been a couple of things at the heart of what we are trying to do with Ampp3d. First of all we are trying to answer the question: What does “data journalism”

Data
Nassos Stylianou introduces you to the various tools used for extracting data from PDFs, and weighs up their pros and cons...

Data
Want to get paid for a data journalism story. Enter our competition and you could be featured on Ampp3d...