How to make a choropleth map with Google Fusion Tables
Sophie Murray-Morris shows you how to make an easy choropleth map using Google Fusion Tables to help you visualise your data.

Data mapping is becoming an increasingly popular way of visualising information. It's quite straightforward to make a choropleth map and in this post I'm going to show you how to make one using Google Fusion Tables.
A fortnight ago I made a choropleth map to go alongside this story for the Hackney Post.

The map was designed to show the increase in the number of Hackney residents commuting to work by cycling over the last decade. I thought I’d use a map as it is more visual and quickly tells the story. Stating that “Dalson had a rise of 10.9%, whereas Hoxton’s increase was only 5.3%, unlike Clissold...” would undeniably bore the reader.
I’m briefly going to show you how to create your own choropleth map.
The data that I used is from the Greater London Authority’s website and was published in October.
First of all I created a Google Docs spreadsheet showing the percentage increase of every Hackney ward:
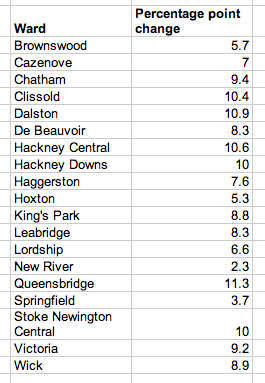
Once I had manually entered these data, I put them on to a map using Google Fusion Tables. Once you load up Fusion Tables, all you need to do is import your Google Docs spreadsheet:
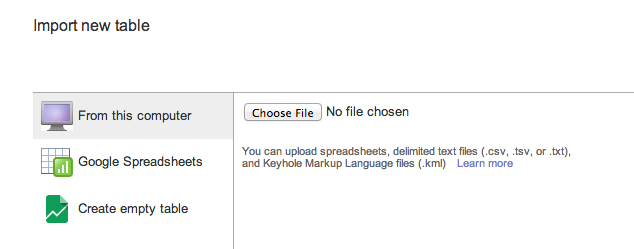
Now you need to find the map data to visualise the cycling data on a map. What you’re looking for here is a “KMZ Shapefile”. Thankfully, Ændrew Rininsland (former City Uni hack, now News Developer at The Times) uploaded a shapefile of all Hackney ward map data. If you download any shapefile of the area that you’re trying to map, that should work fine. Next, upload the .kmz file to your Google Drive.
Now, go back to the Google Fusion Table and click:
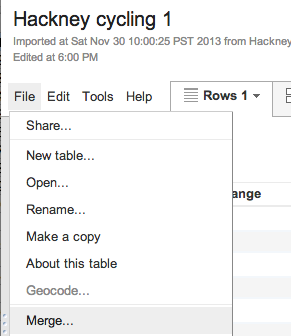
Select the correct .kmz file and merge it based on the field name “ward”, as this will be the same in each table.
This will show you something like this:
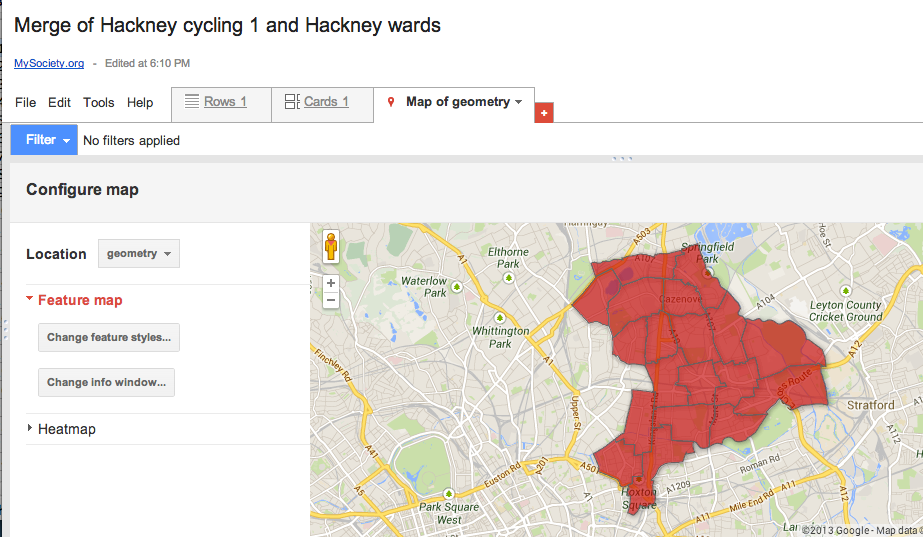
Now, to shade it in different colours dependent on intensity, go to feature map > change feature styles > buckets:
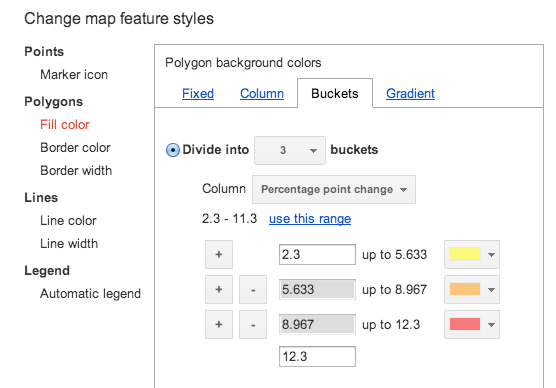
This will end up with something like this:
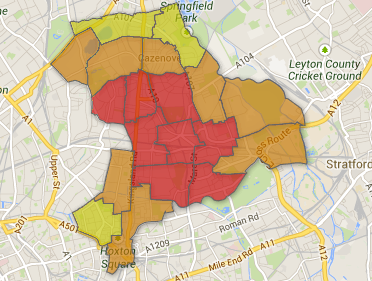
Then all I did was add the ward names using Adobe Photoshop.
Once you get used to using Google Fusion Tables, they are a fast and easy way to visualise your data.


